Neighbourhood
A home is more than four walls: the neighbourhood shapes how you live. Here you’ll learn which neighbourhood figures we show and how to use them.
Check an address
Enter an address and go straight to neighbourhood in the report.
What do we show?
We show key figures from Statistics Netherlands (CBS) for the neighbourhood (buurt) of the address: number of residents, average WOZ value, share of owner-occupied homes, families with children and people aged 65+, and how urban the area is. Each figure is compared with the Netherlands as a whole.
Why does it matter?
Neighbourhood figures help you get to know an area before you move in. A neighbourhood with many families feels different from one with many students. And whether the GP, supermarket and school are around the corner, you notice every day.
How to read the numbers
All figures describe the whole neighbourhood, not one home. The WOZ value is an average of all homes, not an asking price. Distances are averages by road; we call something ‘nearby’ within 1 km. CBS fills new years step by step, so for each figure we show the most recent year.
What can you do?
Walk or cycle through the neighbourhood at different times of day. Talk to neighbours and check the municipality’s website for plans for the area, such as new housing or facilities.
Explore the map
Population density per neighbourhood (residents per km²), CBS neighbourhood map 2025. Zoom in on your own neighbourhood. The map is indicative; the report per address explains more.
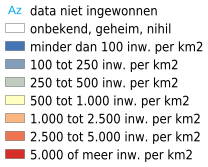
Map source: CBS via PDOK
Frequently asked questions
What is a ‘buurt’ according to CBS?
A buurt is the smallest area for which CBS publishes figures. A municipality is divided into districts (wijken), and districts into neighbourhoods (buurten).
Why are some figures missing?
To protect privacy, CBS leaves out figures when there are too few people or homes. New yearly tables are also filled step by step.
Is the WOZ value the same as the sale price?
No. The WOZ value is set by the municipality for tax purposes and often lags behind the market.
How up to date are the figures?
We use the ‘Kerncijfers wijken en buurten’ tables from 2024 to 2026 and show the year for each figure.